FEM STUDY - EXTENSION OF A CIRCULAR BAR
ME 37100: Computer-Aided Design
Spring 2022
Overview
Finite element analysis, or FEA, is a method of modelling and simulating an object to understand how an object would behave under different physical conditions using the finite element method (FEM). This method works by dividing a complex structure into small components or finite elements connected by nodes in a process known as discretization. The elements get reduced to partial derivative equations, solved using computers' numerical methods. This method approximates the true solution used to determine an object's structural behaviors like stress, strain, and other physical properties. Using this tool helps identify design problems and optimize the design, which eliminates the need for physical prototypes in certain cases.
In this project, FEA is conducted on a circular bar with filleted shoulders using the SolidWorks Simulation tool. The stress and displacement values were determined using the applied load by varying the sizes of the mesh elements. The second objective is to conduct a convergence study with the number of nodes/elements and the stress of the bar. The purpose of doing this is to determine the smallest number of elements needed to ensure that the FEA is not affected by changing the mesh size. In FEA, finer elements yield the highest accuracy compared to coarser element sizes, but the downside is that it increases the simulation run time because of the increase in computations that need to be performed as such reducing the element size further than it needs to decrease the efficiency of a study since it only increases the time needed to arrive at a solution. Therefore, a convergence study is a great way to determine the optimal balance between the accuracy of the results to the true solution and the approximate simulation run time. Lastly, the third objective is to compare the results collected from the simulation to the analytical results of the study, which get calculated using the equations from the mechanics of materials.
The parameters of the solid bar with a filleted shoulder are shown in figure 1. A pressure of 15 MPa was applied in the positive x-direction of the short end of the beam, while the thick end of the beam, which is 20 mm in diameter, was fixed. The material chosen for the model is 1020 steel which has an Elastic Modulus of 200 GPa.

SolidWorks CAD Files
Schematic of the circular bar with a shoulder fillet
Technical Description
For the study, the object is split into three sections. Section A is the thin end of the bar, which is 10 mm in diameter, section B is the filleted section with a radius of 1 mm, and section A is the thick end of the bar with a diameter of 20 mm. Some preliminary conclusions that can be drawn regarding the bar is that displacement will be greater near section A, which is the region near where the force is applied that pulls the rod towards the x-direction. On the other hand, Region C will have the highest resistance to displacement since it is the furthest region from the applied load. Since region C is fixed and has a large cross-sectional area compared to section A, it will be least affected by the loading conditions. The stress will be unevenly distributed since the object has a filleted shoulder. The location with the highest stress concentration will likely be located in region B which is the point where there is a sudden change in the cross-sectional area of the geometry. Due to this change in the geometry, there is increased stress on the object. The region with the minimum stress will likely be towards the end of section C.
For the finite element analysis study, five different tests were conducted. The first test is conducted on the draft quality mesh with 1st order element. The second test is conducted using mesh created with high-quality mesh using second-order elements. In the third test, 2nd order element mesh was utilized with the addition of mesh control. The fourth test is conducted with automatic transition meshing, and the fifth test is conducted with curvature-based meshing. Several simulations were run for each of the tests with varying global element sizes and the local element size. The global element size is the default size of all the elements, while the local element size is the size of the element in a specific region. The results for the test are plotted to determine convergence, and the calculated stress and displacement are compared to the analytical solution

Sections of the bar

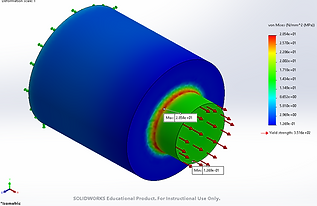
Stress distribution of the bar

Boundary condition of the solid model

1st order element (Draft Quality)

2nd order element (High Quality)

Element of a curvature-based
To conduct the convergence, study the data from all the tests are plotted using excel. The convergence values are compared to the analytical solutions using the equations from the mechanics of the material. Since a stress concentration is located in the filleted section, the max stress is calculated using equation 1.
In this equation, σmax is the maximum stress, Kt is the stress concentration factor, and σnom is the nominal stress. The stress concentration is determined by the stress concentration curve for a filleted shaft in tension as shown in figure 13. The elongation is determined by equation 2.
In this equation, P is the load, L is the original length, A is the area of the cross-section perpendicular to the load, and E is young’s modulus of the steel. The young’s modulus is found under material properties on SolidWorks.

Stress concentration factor curve
Analytical Solution:

Study 1: Simulations with Draft Quality Mesh

Plot of convergence study


Draft quality mesh with a global element size of 10 mm.
Von Mises stress model at draft quality mesh with a global element size of 10 mm.

SX stress of model at draft quality mesh with a global element size of 10 mm.

UX displacement of model at draft quality mesh with a global element size of 10 mm.
Study 2: Simulations with High Quality Mesh

Plot of convergence study


High quality mesh with a global element size of 10 mm.

Von Mises stress model at high quality mesh with a global element size of 10 mm.

SX stress of model at high quality mesh with a global element size of 10 mm.

UX displacement of model at high quality mesh with a global element size of 10 mm.
Study 3: Simulations with High Quality Mesh on the thick section

Plot of convergence study

Study 4: Mesh Control on the Fillet


Stress vs. the number of nodes curves for high-quality mesh with mesh control on the fillet. The local element size at the fillet was varied for each global element size.

High quality mesh with a global element size of 13 mm and a local element size of 4 mm at the fillet.

Von Mises stress model with high quality mesh and mesh control on the fillet.

SX stress of model at with high quality mesh and mesh control on the fillet.

UX displacement of model with high quality mesh and mesh control on the fillet.
Study 5: Mesh Control on the Thin Section


Stress vs. the number of nodes curves for high-quality mesh with mesh control on the thin section. The local element size at the thin section was varied for each global element size.

High quality mesh with a global element size of 11 mm and a local element size of 5 mm at the thin section.


Von Mises stress model with high quality mesh and mesh control on the thin section.
SX stress of model at with high quality mesh and mesh control on the thin section.
UX displacement of model with high quality mesh and mesh control on the thin section.
Study 6: Meshing with Automatic Transition


Plot of convergence study

Automatic transition high quality mesh with a global element size of 10 mm.


Von Mises stress of the model with the automatic transition mesh with a global element size of 10 mm.
SX stress of the model with the automatic transition mesh

SX stress of the model with the automatic transition mesh
Study 7: Curvature-Based Mesh


Plot of convergence study


Curvature-based high-quality mesh with a global element size of 10 mm.
Von Mises stress of the model with the curvature-based mesh with a global element size of 10 mm.
SX stress of the model with the curvature-based mesh
UX displacement of the model with the curvature-based mesh
Discussion
Data summary:

The data from the simulations were compared to the analytical solutions for both stress and displacement. The analytical stress solution for the circular bar was 30 MPa, and the solution for the thicker section was 3.75 MPa. While the analytical stress solution for the displacement of the bar was 0.00750 mm, and the solution for the thicker section was 0.00375 mm. The percent error for the data between the FEM studies and the analytical solution is shown in table 8. Based on the results, it is evident that study 2 yielded the most accurate results, but it took longer to conduct the simulations. On the other hand, curvature-based mesh results in addition to having high accuracy as the change between the two types of solutions (FEM and the analytical solution) was approximately 3.067%, it also had a lower simulation run time. The stress values for all the studies except study 3 are below 6%. Study 3, which calculated the stress at the thick section, yielded the highest error between the calculated and simulated results. This is because when the probe tool was used, the average of the stress distribution was taken, which was affected by the fact that stress is lower in some regions than others.
The percent error for the displacements of all the studies was between 19% and 21%, which is well below the limit of 25% error. Some sources of error in the FEM study are a result of the limitations created by the specs of my computer, which is why I wasn’t able to test the meshes with an element size below 1.5mm.